Click on image to zoom in.
GlobalData released the results of their pharmaceutical market analysis, highlighting the top 25 publically traded global pharmaceutical companies by Market Cap (Mcap).
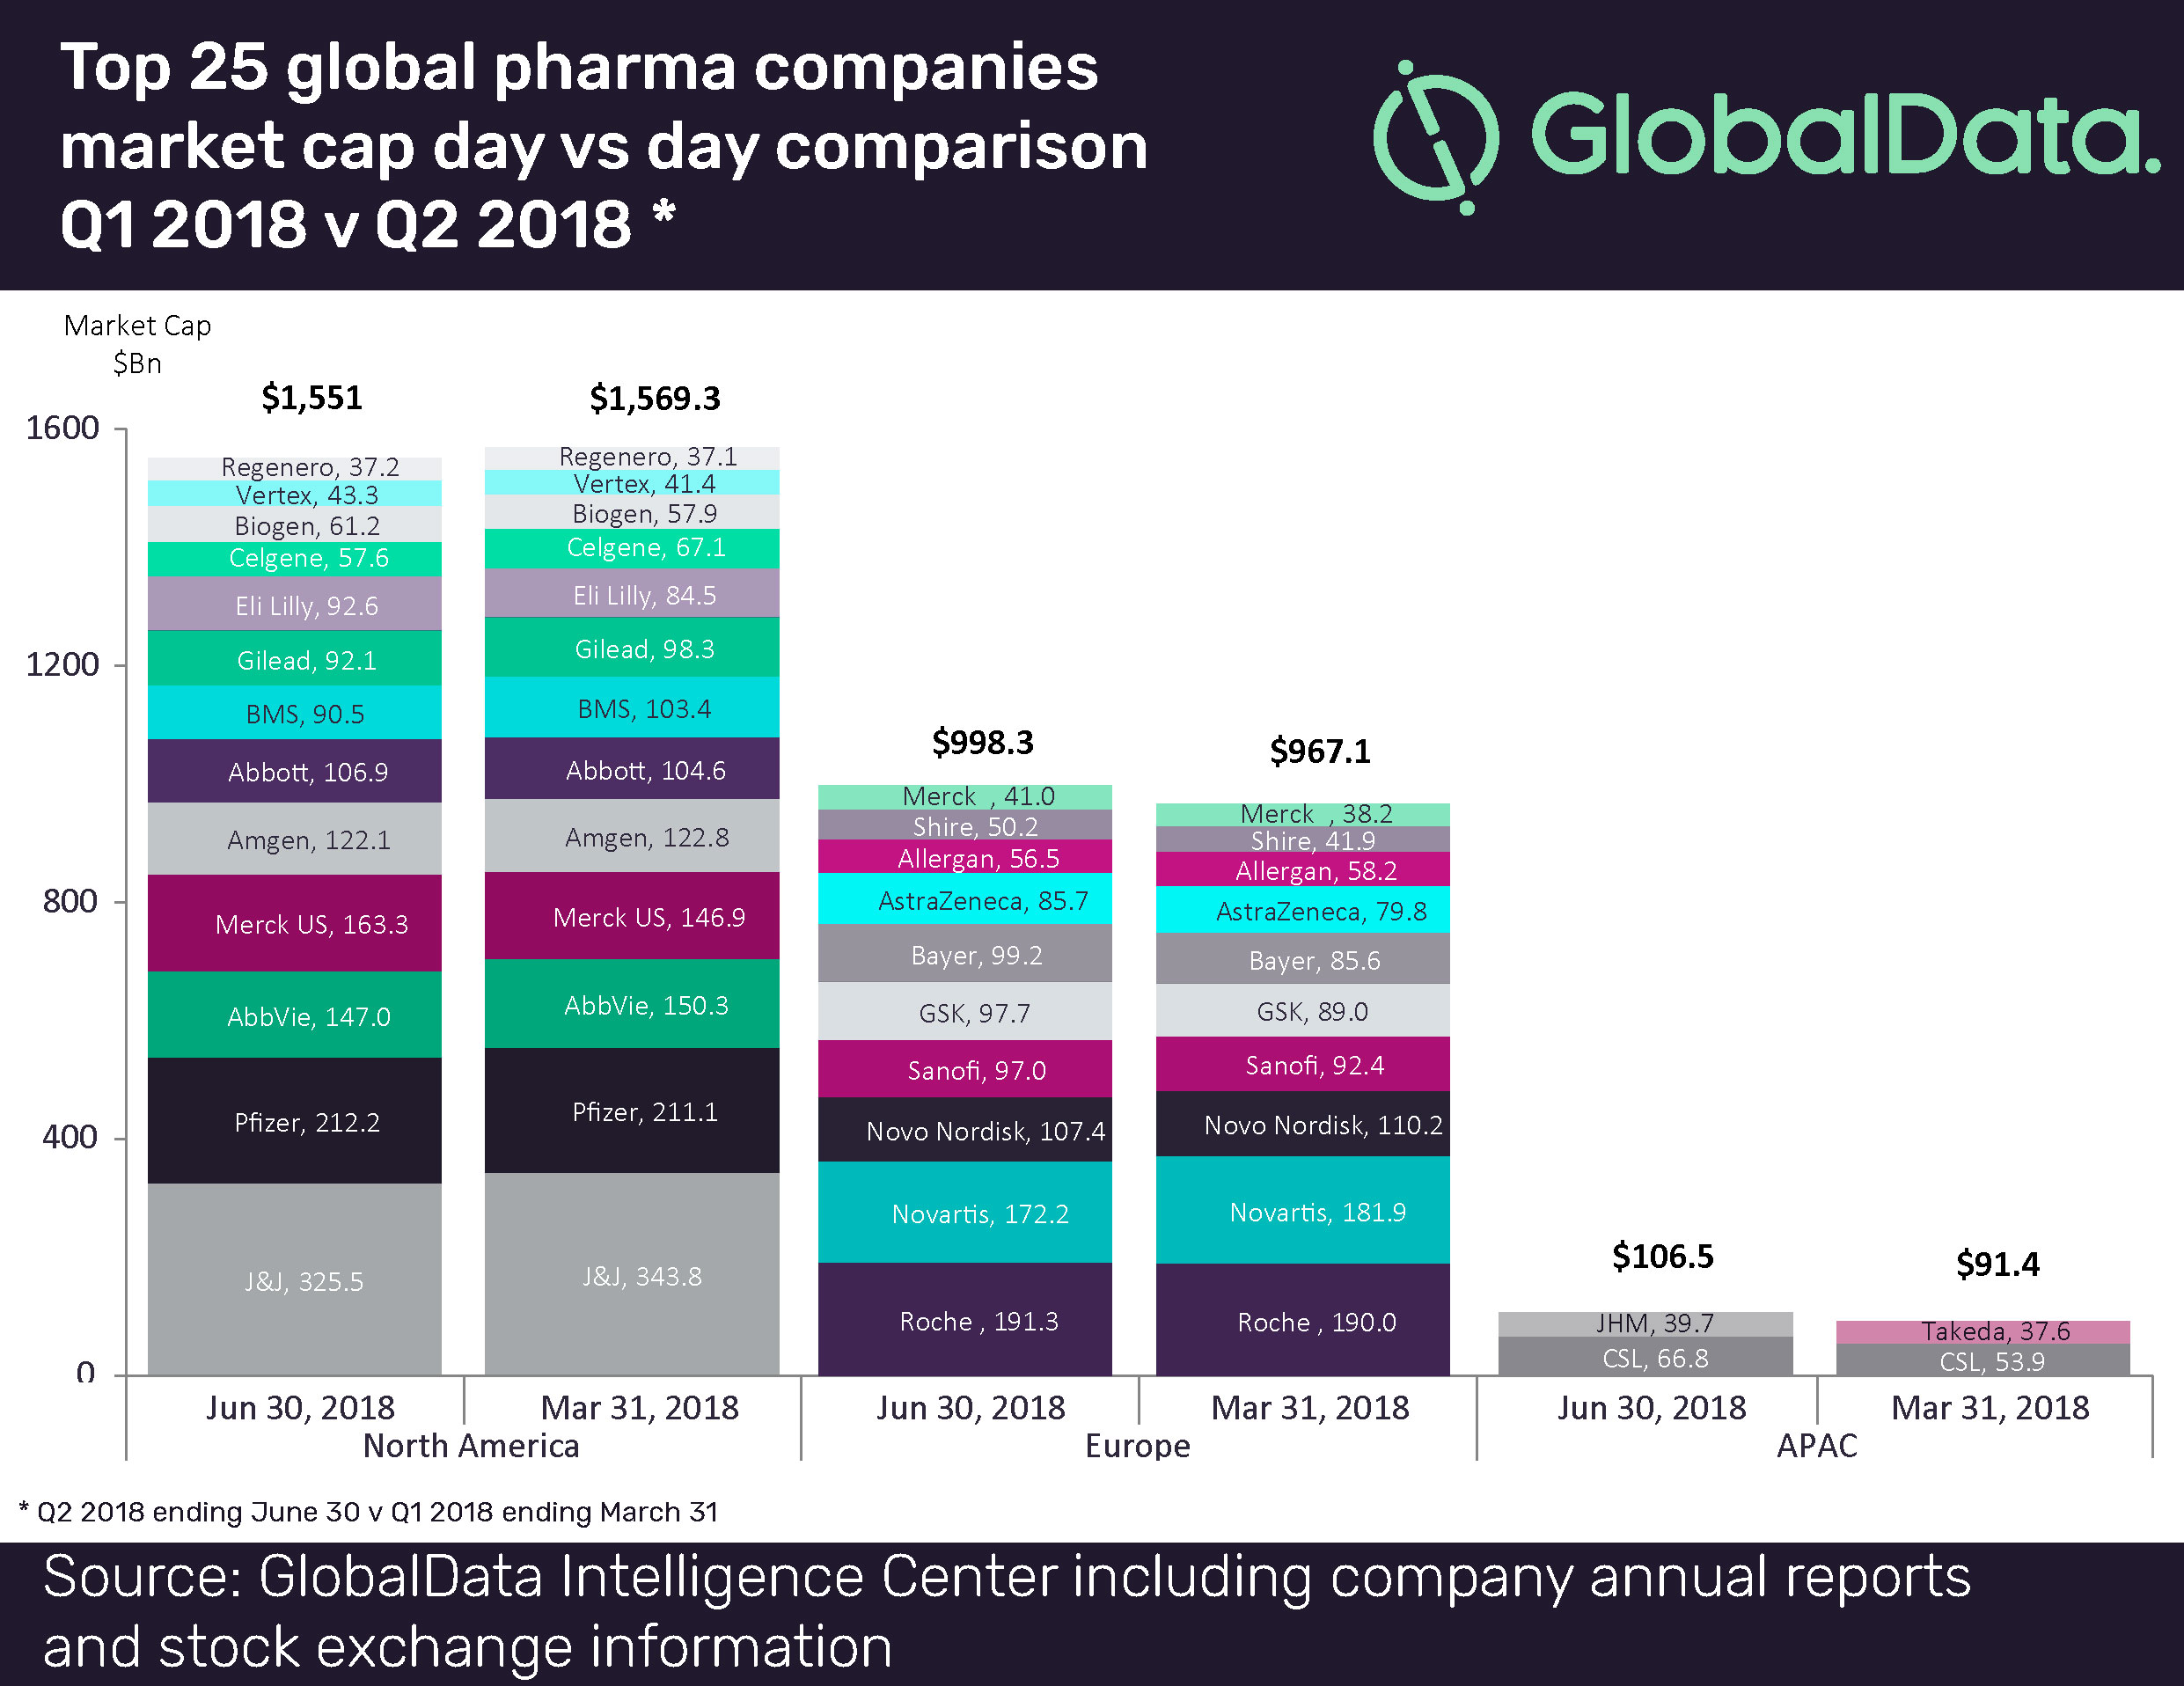
The collective Mcap of the top pharma companies reached roughly $2.7 trillion, with growth at 1.1 percent in Q2 2018. The leading companies—Merck US, Bayer, GSK, Eli Lilly, CSL, and Shire—achieved double digit Mcap growth during the same period.
Some things remained the same—Johnson & Johnson held on to its No. 1 position in the top 25. However, Chinese pharmaceutical company, Jiangsu Hengrui Medicine, made its first appearance on the list.
Six companies saw positive Mcap growth, with CSL, Shire, and Bayer achieving double digit growth rates of 24 percent, 20 percent, and 16 percent, respectively.
Click on image to zoom in.
Due to what is believed to be the result of significant share trading, Bristol-Myers Squibb saw an more than 10 percent decline in Q2 2018. Celgene also experienced a similar decline due possibly to setbacks in some key pipeline drugs.
Geographically, the data reveals that North America contributed an aggregate Mcap of $1.5 trillion, with 13 companies from this region featuring in the top 25 list. The Mcap of European and Asia-Pacific pharmaceutical companies grew 3.2 percent and 16.5 percent, respectively.
According to GlobalData, the results show a growing trend among big pharma to focus on their core business areas.
(Source: GlobalData)